The Clariprod portal: real-time data and business intelligence
Collect and analyze real-time data
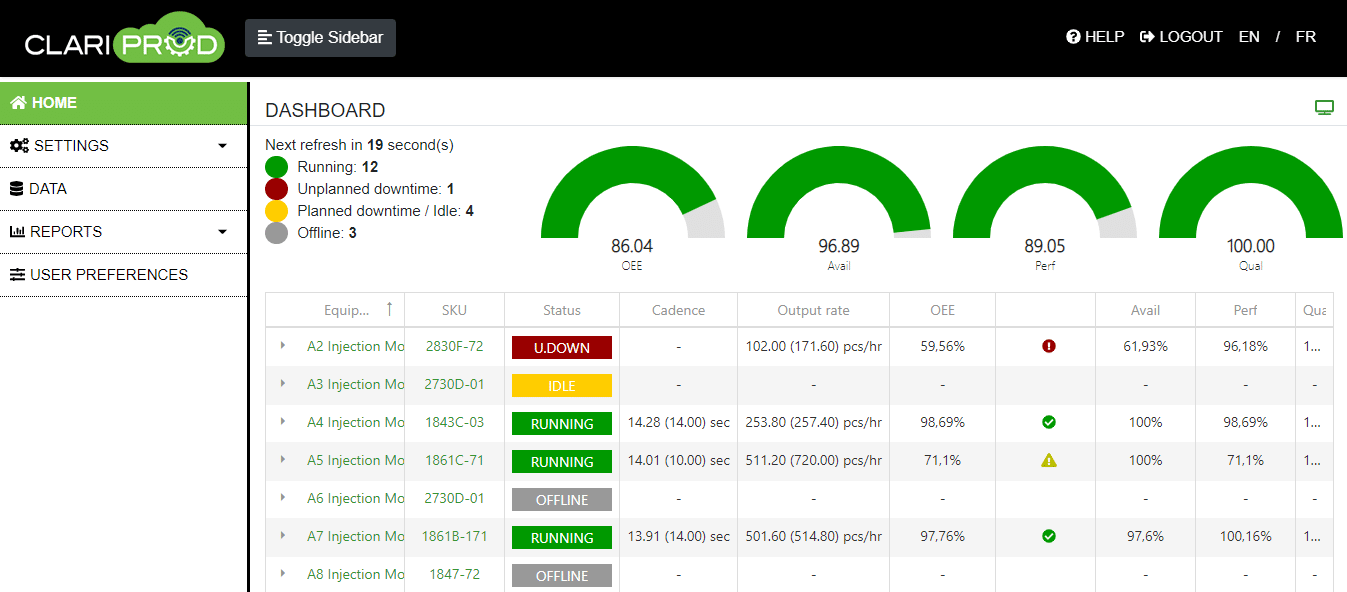
With the Clariprod portal, visualize real-time machines and production rate through a live dashboard, performance reports, and instant alerts on any device with unlimited users. Plant managers will get actionable insights from machinery and operations, while executives analyze reports on critical KPIs at any time to take data-based decisions.
Transform business intelligence into actions to reduce machine downtimes, increase throughput and reduce rejects.


Real-time data on machine performance and operations
Our dashboard also allows you to:
For each machine, see in real time:
At a glance, you can visualize critical production data on the current shift or day to get immediate feedback, allowing operations to maintain or exceed production targets.
Performance reports based on real-time and historical data
The Clariprod portal allows you to generate a multitude of reports at any time and in only a few minutes, based on both real-time and historical data. Reports are also personalized based on your own causes of downtimes and rejects in the settings.
Here are some examples of reports.
Production
Generate reports about your overall production, like your production summary (good parts and work orders) or your part-made trend (comparing all parts made from each machine).
OEE
Generate more elaborate reports.
Availability
Measure your most frequent downtime causes and analyze the duration of your unplanned downtime events.
Performance
Measure and analyze your machine cycle times to make sure they are not running off-cycle, and optimize your output rate.
Quality
The Clariprod portal also allows you
to generate reports about your reject causes and the quality trend of your machines, to optimize your waste.
Real-time alerts
Production or plant managers can have a difficult time keeping track of everything happening in the factory.
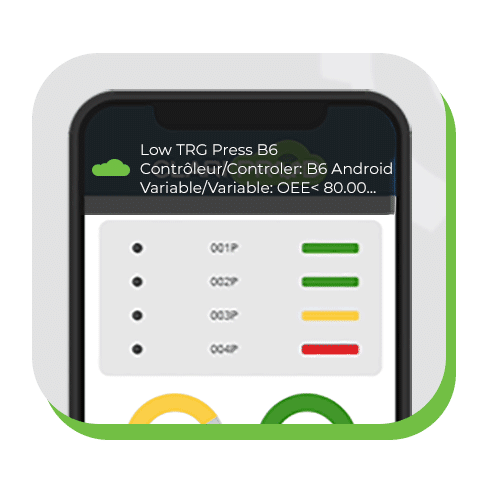
Real-time alerts notify them as soon as something happens, like a machine slowdown or an unplanned downtime, allowing them to take corrective actions to fix it immediately and save time and money.

Specific to Clariprod

No data loss when internet is down

Compatible with any ERP system to exchange real-time data
